library(shiny)
library(shiny.semantic)
library(tidyverse)
library(readr)How to Build Accordions in R Shiny Using Shiny.Semantic
R Shiny
Build beautiful accordions for KPI reporting using Appsilon’s shiny.semantic package
The accordion is an underrated data visualization. It can display text, tables, and small graphs in a confined space, which makes it easy for the user to quickly read through key data points.
At Free State Analytics, we recently built the following accordions for an application. We planned to use these accordions in a few places throughout the application, so we made extensive use of modules to make this functionality possible.
This tutorial will teach you how to build this custom accordion using R Shiny and Appsilon’s R Shiny Semantic. We will not use a pre-built function that produces an accordion, but rather reference the semantic CSS directly using the div function.
The tutorial will use two pre-cleaned data sets for household carbon emissions to report in the accordion. The accordion requirements include:
- Aggregated emissions reported at the top
- Aggregated emissions reported by category
- Aggregated emissions reported by sub-category
- Dynamic time period labels for the accordion title, total metric at the top, and each of the headings
- The ability to expand or collapse the sub-category figures under the category headings
- The ability to re-use the module for various time periods
For those who find it easier to learn through reverse engineering other people’s code, you can find the complete code for the modules here.
Otherwise, keep reading for a step-by-step tutorial.
Prerequisites
This tutorial requires the following packages to work:
You’ll also want to download this data set here:
household_estimates <- read_csv("https://raw.githubusercontent.com/taylorrodgers/public_datasets/main/household_carbon_estimates.csv")
total_estimates <- read_csv("https://raw.githubusercontent.com/taylorrodgers/public_datasets/main/total_household_estimates.csv")
When it comes to prior knowledge, you should know the following:
The purpose of a Shiny module, at least conceptually speaking
How to write and use custom R functions
However, it’s not important to be an expert in these things. This tutorial will improve your skills in these areas with this real-world example.
Building Shiny App Foundation
Since our accordion will use Shiny Semantic, we’ll use the semanticPage function in our application’s UI.
Down below are the ui and server that will later call our modules.
library(shiny)
library(shiny.semantic)
library(tidyverse)
library(readr)

household_estimates <- read_csv("https://raw.githubusercontent.com/taylorrodgers/public_datasets/main/household_carbon_estimates.csv")
total_estimates <- read_csv("https://raw.githubusercontent.com/taylorrodgers/public_datasets/main/total_household_estimates.csv")

ui <- function() {
  semanticPage(
    h2("Our Accordions"),
    div(class="ui stackable grid",
        div(class="four wide column",
            h3("Totals by Category"),
            div(class="ui raised segment",
                style="min-width: 550px;",
                tableOutput("TestTable")
            )
        )
    )
  )
}

server <- function(input, output, session) {

  output$TestTable <- renderTable({
    total_estimates
  })

}

shinyApp(ui = ui(), server = server)
Right now, our app is fairly empty. We’ll add more and more to it as the tutorial progresses. I included TestTable to allow you to validate your work as you go.
One thing to note is how I use the div functions and the class argument within them.
The class argument allows us to reference specific CSS elements defined in the Fomantic-UI framework. Fomantic-UI is the new name for Semantic-UI, which shiny.semantic uses.
You can use this link for a reference on how these elements are used: https://fomantic-ui.com/
We’ll make heavy use of the div function and its class argument throughout the tutorial.
Creating “Master” Accordion Modules
Let’s build the module to house our accordion. We’ll need to use a Shiny module because we’ll re-use the same accordion for reporting a household’s carbon emissions in three separate time periods (week, month, and year).
Modules always come in pairs: a ui and a server. We’ll call these modules accordionMasterUI and accordionMasterServer, respectively.
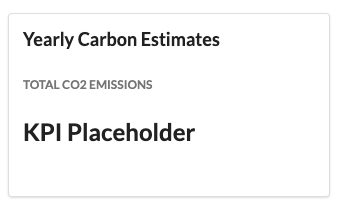
accordionMasterUI <- function(id) {

  tagList(
    div(class = "ui segment",
        h3("Yearly Carbon Estimates"),
        h3(class="ui grey sub header","Total CO2 Emissions"),
        h2("KPI Placeholder"),
        br()
        )
    )

}

accordionMasterServer <- function(id) {
  moduleServer(id,function(input,output,session) {


  })
}
We use “ui segment” for our class argument in the div function above. This will make a nice clean border around our future accordion. You can read about segments here: https://fomantic-ui.com/elements/segment.html
We use h2 and h3 to determine how our labels appear. Just like with div, you can use the class argument to determine the way the header will display. You can read more about headers here: https://fomantic-ui.com/elements/header.html
Let’s add this module to our app’s ui and server functions.
ui <- function() {
  semanticPage(
    h2("Our Accordions"),
    div(class="ui stackable grid",
        div(class="three wide column",
            style="min-width: 350px;",
            accordionMasterUI("accordion")
        ),
        div(class="four wide column",
            h3("Totals by Category"),
            div(class="ui raised segment",
                style="min-width: 550px;",
                tableOutput("TestTable")
            )
        )
    )
  )
}

server <- function(input, output, session) {

  accordionMasterServer("accordion")

  output$TestTable <- renderTable({
    total_estimates
  })

}

shinyApp(ui = ui(), server = server)
This app still doesn’t reveal much information, but you can at least see the look of our accordionMasterUI.
Let’s start building the accordion itself.
Building Our Accordion
The semantic CSS element for an accordion is “ui accordion.” So we’ll need to create a new div and set class="ui accordion".
Let’s add the accordion itself to accordionMasterUI function we just created, like so:
accordionMasterUI <- function(id) {
tagList(
div(class = "ui segment",
h3("Yearly Carbon Estimates"),
h3(class="ui grey sub header","Total CO2 Emissions"),
h2("KPI Placeholder"),
br(),
div(class="ui accordion"
)
)
)
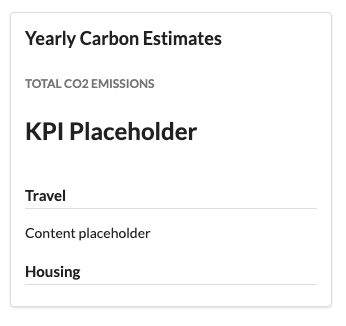
}Within the new accordion, we’ll need additional div functions. These will come in pairs for each section of the accordion: title and content. We’ll use the class argument to specify them.
Down below, I added two pairs of div functions. These also include the headers for the title and a placeholder value for the content.
accordionMasterUI <- function(id) {
  tagList(
    div(class = "ui segment",
        h3("Yearly Carbon Estimates"),
        h3(class="ui grey sub header","Total CO2 Emissions"),
        h2("KPI Placeholder"),
        br(),
        div(class="ui accordion",
            ### Title
            div(class ="title",
                h4(class="ui dividing header","Travel")
            ),
            ### Content
            div(class = "content",
                p("Content placeholder")
            ),
            ### Title
            div(class ="title",
                h4(class="ui dividing header","Housing")
            ),
            ### Content
            div(class = "content",
                p("Content placeholder")
            )
        )
    )
  )
}
If you run the app, the accordion won’t currently expand or collapse the content. We’ll need to write a few more lines of code before this functionality works.
First, we can define which sections of the accordion will automatically expand whenever the user opens the application. This will give the user a hint that the accordion is interactive. Otherwise, they may assume the accordion is a simple list of static KPI metrics.
Down below, I update the class argument for the first pair of div functions to “title active” and “content active”.
accordionMasterUI <- function(id) {
  tagList(
    div(class = "ui segment",
        h3("Yearly Carbon Estimates"),
        h3(class="ui grey sub header","Total CO2 Emissions"),
        h2("KPI Placeholder"),
        br(),
        div(class="ui accordion",
            ### Title
            div(class ="title active",
                h4(class="ui dividing header","Travel")
            ),
            ### Content
            div(class = "content active",
                p("Content placeholder")
            ),
            ### Title
            div(class ="title",
                h4(class="ui dividing header","Housing")
            ),
            ### Content
            div(class = "content",
                p("Content placeholder")
            )
        )
    )
  )
}
Now when you run the app, you’ll see the “content placeholder” appear immediately.
However, we still can’t click and expand the housing content. We’ll need to add a JavaScript function to enable that interactivity.
Adding the JavaScript Function
At the top of your application script, right after you load your packages, add the following:
# Javascript for Accordion
accordion_js <- "
$(document).ready(function() {
  $('.ui.accordion').accordion();
})"
Inside the accordionMasterUI function, add shiny::tags$script(accordion_js) to the tagList, like so:
accordionMasterUI <- function(id) {
  tagList(
    shiny::tags$script(accordion_js),
    div(class = "ui segment",
        ...

    )
  )
}
Run your app again. Click around on the accordion and you’ll notice the sections expand and collapse.
Why Not Use the
accordion Function?
Within the shiny.semantic package, there is a function called accordion that enables a similar feature. I’m personally not a fan of using functions to call CSS elements.
A key benefit that R Shiny has over other dashboard dev tools is the precision. We can define exactly the functionality we want when we write out the scripts ourselves.
While the shiny.semantic package is great for writing reactive programming with the semantic CSS framework, the functions unrelated to inputs or outputs don’t always provide the precision we need.
In those instances, I find it better to simply use div(class = [element name], …) to define the interface features.
Adding Real Data to the Accordion
Let’s add real data to our accordion.
First, let’s replace the “KPI placeholder” in our h2 with a textOutput to show the total carbon emissions across categories.
accordionMasterUI <- function(id) {
  tagList(
    div(class = "ui segment",
        h3("Yearly Carbon Estimates"),
        h3(class="ui grey sub header","Total CO2 Emissions"),
        h2(textOutput(NS(id,"GrandTotal"))),
        ...
    )
  )
}
We’ll need to pair this textOutput function with renderText in our accordionMasterServer.
accordionMasterServer <- function(id) {
  moduleServer(id,function(input,output,session) {

    output$GrandTotal <- renderText({
      total_estimates %>%
        filter(total_type=="Grand") %>%
        transmute(grandtotal=round(yearly_emissions,2)) %>%
        paste0(.)
    })

  })

}
Now when you run the application, you’ll see a grand total for household emissions at the top of the accordion.
Make Sure You Use Namespaces!
Namespaces are a key concept with modules. In plain english, it reduces conflicts when using the same module repeatedly within an application.
For example, in the ui function above, we have a textOutput named “GrandTotal.” That is paired with output$GrandTotal <- renderText({…}) in the server object.
If a Shiny app re-uses this module (which ours will), we’ll have multiple “GrandTotal” outputs in our session. The app won’t know how to pair the outputs effectively between the ui and the server.
Whenever we use NS(id, "GrandTotal") to assign the textOutput an id, we are prefixing the name “GrandTotal” with the id we’ll provide the module.
In our final script for this tutorial, we’ll call our accordionMasterUI module three times and name them year, month, and week. That will turn the three ambigiously named “GrandTotal” outputs into “year.GrandTotal”, “month.GrandTotal”, and “week.GrandTotal”, respectively, in our session.
That eliminates the conflict for the app and allows all three to run simultaneously.
Let’s also replace the placeholders for our titles and contents with either textOutput or tableOutput, respectively:
accordionMasterUI <- function(id) {
  tagList(
    shiny::tags$script(accordion_js),
    div(class = "ui segment",
        h3("Yearly Carbon Estimates"),
        h3(class="ui grey sub header","Total CO2 Emissions"),
        h2(textOutput(NS(id,"GrandTotal"))),
        br(),
        div(class="ui accordion",
            ### Title
            div(class ="title active",
                h4(class="ui dividing header",textOutput(NS(id,"TravelTotal")))
            ),
            ### Content
            div(class ="content active",
                tableOutput(NS(id,"TravelSubTotals"))
            ),
            ### Title
            div(class ="title",
                h4(class="ui dividing header",textOutput(NS(id,"HousingTotal")))
            ),
            ### Content
            div(class ="content",
                tableOutput(NS(id,"HousingSubTotals"))
            )
        )
    )
  )
}
We’ll also need to update the server module function to present these outputs, like so:
accordionMasterServer <- function(id) {
  moduleServer(id,function(input,output,session) {

    output$GrandTotal <- renderText({
      total_estimates %>%
        transmute(grandtotal=round(yearly_emissions),2)) %>%
        paste0(.)
    })

    output$TravelTotal <- renderText({
      total_estimates %>%
        filter(total_type=="Travel") %>%
        transmute(emissions=round(yearly_emissions,2)) %>%
        paste0(.," /yr")
    })

    output$TravelSubTotals <- renderTable({
      household_estimates %>%
        filter(categories=="Travel") %>%
        arrange(subcategories) %>%
        group_by(subcategories) %>%
        summarize(emissions=sum(round(yearly_emissions,2))) %>%
        rename(Subcategories=subcategories,Emissions=emissions)
    })


    output$HousingTotal <- renderText({
      total_estimates %>%
        filter(total_type=="Housing") %>%
        transmute(emissions=round(yearly_emissions,2)) %>%
        paste0(.," /yr")
    })

    output$HousingSubTotals <- renderTable({
      household_estimates %>%
        filter(categories=="Housing") %>%
        arrange(subcategories) %>%
        group_by(subcategories) %>%
        summarize(emissions=sum(round(yearly_emissions,2))) %>%
        rename(Subcategories=subcategories,Emissions=emissions)
    })

  })
}
Run the app again and click around on the accordion. Something isn’t working, right?
The accordion won’t reveal the data for the housing content section.
We’ll need to add the following script to our accordionMasterServer module function. Go ahead and run the app afterwards to see how it responds.
outputOptions(output, "HousingSubTotals", suspendWhenHidden = FALSE)I had learned about how the function above fixes this problem in a stack overflow comment. Sadly, I did not save the link. I wish I could give proper credit.
Adding Dynamic Date Selectors and Labels
A key requirement for this accordion module relates to dates. We want to use the same module three times to report on carbon emissions at the year, month, and week level. So far, we’ve hard coded the time period to be a year.
If we want the module to report on month or week instead, we will need the module select the proper column from the data sets and update the labels within the accordion.
We can drive this change throughout the module by adding “period” as an argument to our accordionMasterUI and accordionMasterServer module functions, like so:
accordionMasterUI <- function(id,period) {
 ...
}

accordionMasterServer <- function(id,period) {
 ...
}
We also need to update the ui and server functions for our application, which is where we call the accordion modules.
Down below, I added the period="year" to both accordionMasterUI and accordionMasterServer.
ui <- function() {
  semanticPage(
    h2("Our Accordions"),
    div(class="ui stackable grid",
        div(class="three wide column",
            style="min-width: 350px;",
            accordionMasterUI("accordion",period="year")
        ),
        div(class="four wide column",
            h3("Totals by Category"),
            div(class="ui raised segment",
                style="min-width: 550px;",
                tableOutput("TestTable")
            )
        )
    )
  )
}

server <- function(input, output, session) {

  accordionMasterServer("accordion",period="year")

  output$TestTable <- renderTable({
    total_estimates
  })

}
This doesn’t change anything in our accordion, yet. We still need to apply these new arguments in our accordion modules.
Let’s update our data wrangling functions to select the appropriate columns. We can use the select, contains, and rename functions from the tidyverse package to make this easy.
Down below is what the data wrangling scripts would look outside of an application. Notice that I define the period as “year” and use select to grab any column that contains the word “year.” We could do the same for month and week as well.
period <- "year"

total_estimates %>%
  select(total_type,contains(period)) %>%
  rename(emissions=2) %>%
  filter(total_type=="Travel") %>%
  transmute(emissions=round(emissions,2)) %>%
  paste0(.," /yr")

household_estimates %>%
  select(categories,subcategories,contains(period)) %>%
  rename(emissions=3) %>%
  filter(categories=="Travel") %>%
  arrange(subcategories) %>%
  group_by(subcategories) %>%
  summarize(emissions=sum(round(emissions,2))) %>%
  rename(Subcategories=subcategories,Emissions=emissions)
One thing that we’ll need to do in the app is attach the proper label to the category totals reported. So “/yr”, “/mo”, or “/wk”.
We can write an ifelse statement to accomplish this, like so:
period <- "year"

total_estimates %>%
  select(total_type,contains(period)) %>%
  rename(emissions=2) %>%
  filter(total_type=="Travel") %>%
  transmute(emissions=round(emissions,2)) %>%
  paste0(.,ifelse(period=="year"," /yr",
                  ifelse(period=="month"," /mo",
                         " /wk")))
Let’s add this to our accordionMasterServer module function:
accordionMasterServer <- function(id,period) {
  moduleServer(id,function(input,output,session) {

    output$GrandTotal <- renderText({
      total_estimates %>%
        transmute(grandtotal=round(yearly_emissions),2)) %>%
        paste0(.)
    })

    output$TravelTotal <- renderText({
      total_estimates %>%
        select(total_type,contains(period)) %>%
        rename(emissions=2) %>%
        filter(total_type=="Travel") %>%
        transmute(emissions=round(emissions,2)) %>%
        paste0(.,ifelse(period=="year"," /yr",
                        ifelse(period=="month"," /mo"," /wk")))
    })

    output$TravelSubTotals <- renderTable({
      household_estimates %>%
        select(categories,subcategories,contains(period)) %>%
        rename(emissions=3) %>%
        filter(categories=="Travel") %>%
        arrange(subcategories) %>%
        group_by(subcategories) %>%
        summarize(emissions=sum(round(emissions,2))) %>%
        rename(Subcategories=subcategories,Emissions=emissions)
    })


    output$HousingTotal <- renderText({
      total_estimates %>%
        select(total_type,contains(period)) %>%
        rename(emissions=2) %>%
        filter(total_type=="Housing") %>%
        transmute(emissions=round(emissions,2)) %>%
        paste0(.,ifelse(period=="year"," /yr",
                        ifelse(period=="month"," /mo"," /wk")))
    })

    output$HousingSubTotals <- renderTable({
      household_estimates %>%
        select(categories,subcategories,contains(period)) %>%
        rename(emissions=3) %>%
        filter(categories=="Housing") %>%
        arrange(subcategories) %>%
        group_by(subcategories) %>%
        summarize(emissions=sum(round(emissions,2))) %>%
        rename(Subcategories=subcategories,Emissions=emissions)
    })

    outputOptions(output, "HousingSubTotals", suspendWhenHidden = FALSE)

  })
}
You can change the period argument to “month” or “week” in the app and see how it changes for you. You can use the “TestTable” on the right of the app to verify the results.
ui <- function() {
  semanticPage(
    h2("Our Accordions"),
    div(class="ui stackable grid",
        div(class="three wide column",
            style="min-width: 350px;",
            accordionMasterUI("accordion",period="month")
        ),
        div(class="four wide column",
            h3("Totals by Category"),
            div(class="ui raised segment",
                style="min-width: 550px;",
                tableOutput("TestTable")
            )
        )
    )
  )
}

server <- function(input, output, session) {

  accordionMasterServer("accordion",period="month")

  output$TestTable <- renderTable({
    total_estimates
  })

}

shinyApp(ui = ui(), server = server)
Our accordion isn’t fully dynamic though. We still have a header at the top showing “Yearly Carbon Estimates,” even when we set the period argument to week. The same for our grand total KPI at the top, which is still hard coded to show the yearly data and still doesn’t have a label itself.
We can fix the label at the top real easy with a another ifelse function.
accordionMasterUI <- function(id,period) {
tagList(
shiny::tags$script(accordion_js),
div(class = "ui segment",
h3(paste(ifelse(period=="year","Yearly",
ifelse(period=="month","Monthly","Weekly")),
"Carbon Estimates")),
...
)
)
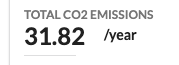
}Our grand total output needs a label too and also needs to report the proper data, based on the period argument.
The label for the grand total is trickier to pull off than the others.
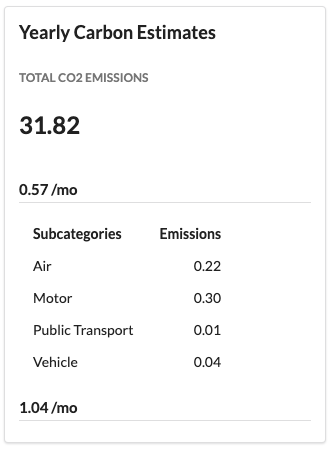
Down below is what we’re working towards with this tutorial. If you pay close attention, the actual metric and the ” /month” label have some space between them. That’s because they have two separate formats. The time period label is smaller than the metric. We’ll need to use two textOutput functions to make this work.
In the accordionMasterUI, let’s create a new set of div functions for our grand total output and label. We’ll use the “ui grid” element, a “four column row”, and two “columns” within it, like so:
accordionMasterUI <- function(id,period) {
  tagList(
    shiny::tags$script(accordion_js),
    div(class = "ui segment",
        h3(paste(ifelse(period=="year","Yearly",
                        ifelse(period=="month","Monthly","Weekly")),
                 "Carbon Estimates")),
        h3(class="ui grey sub header","Total CO2 Emissions"),
        div(class="ui grid",
            div(class="four column row",
                div(class="column",
                       h2(textOutput(NS(id,"GrandTotal")))),
                div(class="column",
                      " /year"
                )
            )),
        …
    )
  )
}
Run the app again and see how it looks.
Doesn’t look bad, does it? Still needs improvement.
If we set the class argument for the h2 to “ui dividing header”, it’ll give the “GrandTotal” output a nice little underline. We can also wrap the ” /year” text in strong to make it bolder.
accordionMasterUI <- function(id,period) {
  tagList(
    shiny::tags$script(accordion_js),
    div(class = "ui segment",
        h3(paste(ifelse(period=="year","Yearly",
                        ifelse(period=="month","Monthly","Weekly")),
                 "Carbon Estimates")),
        div(class="ui grid",
            div(class="four column row",
                div(class="column",
                    h2(class="ui dividing header",
                       textOutput(NS(id,"GrandTotal")))),
                div(class="column",
                    strong(" /year")
                )
            )),
        …
    )
  )
}
Now it looks a lot more polished than before.
The period label still isn’t dynamic though. Let’s replace ” /year” with the script below so that it changes with the period the module uses.
ifelse(period=="year"," /year",
       ifelse(period=="month"," /month"," /week"))
We’re almost done with our grand total KPI. One last thing to do is update the output itself to select the proper column, depending on the period argument of the modules.
In accordionMasterServer, update output$GrandTotal to select the proper column, like so:
output$GrandTotal <- renderText({
  total_estimates %>%
    select(total_type,contains(period)) %>%
    rename(emissions=2) %>%
    filter(total_type=="Grand") %>%
    transmute(grandtotal=round(emissions,2)) %>%
    paste0(.)
})
Run the app again and see how it looks. Starting to come together, right?
We still need to include other categories in our accordion. However, we’re about to reach a particular threshold with our code where it’s better to reduce redundancies before moving forward. This is an ideal point to create an additional set of modules and functions. This will provide more ease with improving the aesthetics of our accordion’s titles and content.
Checkpoint
We’re about to change a lot of things. In order to make sure we’re on the same page, check your code against the code below, or simply copy and paste the entire script.
library(shiny)
library(shiny.semantic)
library(tidyverse)
library(readr)

accordion_js <- "
$(document).ready(function() {
  $('.ui.accordion').accordion();
})"

household_estimates <- read_csv("https://raw.githubusercontent.com/taylorrodgers/public_datasets/main/household_carbon_estimates.csv")
total_estimates <- read_csv("https://raw.githubusercontent.com/taylorrodgers/public_datasets/main/total_household_estimates.csv")

accordionMasterUI <- function(id,period) {
  tagList(
    shiny::tags$script(accordion_js),
    div(class = "ui segment",
        h3(paste(ifelse(period=="year","Yearly",
                        ifelse(period=="month","Monthly","Weekly")),
                 "Carbon Estimates")),
        h3(class="ui grey sub header","Total CO2 Emissions"),
        div(class="ui grid",
            div(class="four column row",
                div(class="column",
                    h2(class="ui dividing header",textOutput(NS(id,"GrandTotal")))),
                div(class="column",
                    strong(
                      ifelse(period=="year"," /year",
                             ifelse(period=="month"," /month"," /week"))
                    )
                )
            )),
        br(),
        div(class="ui accordion",
            ### Title
            div(class ="title active",
                h4(class="ui dividing header",textOutput(NS(id,"TravelTotal")))
            ),
            ### Content
            div(class ="content active",
                tableOutput(NS(id,"TravelSubTotals"))
            ),
            ### Title
            div(class ="title",
                h4(class="ui dividing header",textOutput(NS(id,"HousingTotal")))
            ),
            ### Content
            div(class ="content",
                tableOutput(NS(id,"HousingSubTotals"))
            )
        )
    )
  )
}

accordionMasterServer <- function(id,period) {
  moduleServer(id,function(input,output,session) {

    output$GrandTotal <- renderText({
      total_estimates %>%
        select(total_type,contains(period)) %>%
        rename(emissions=2) %>%
        filter(total_type=="Grand") %>%
        transmute(grandtotal=round(emissions,2)) %>%
        paste0(.)
    })

    output$TravelTotal <- renderText({
      total_estimates %>%
        select(total_type,contains(period)) %>%
        rename(emissions=2) %>%
        filter(total_type=="Travel") %>%
        transmute(emissions=round(emissions,2)) %>%
        paste0(.,ifelse(period=="year"," /yr",
                        ifelse(period=="month"," /mo"," /wk")))
    })

    output$TravelSubTotals <- renderTable({
      household_estimates %>%
        select(categories,subcategories,contains(period)) %>%
        rename(emissions=3) %>%
        filter(categories=="Travel") %>%
        arrange(subcategories) %>%
        group_by(subcategories) %>%
        summarize(emissions=sum(round(emissions,2))) %>%
        rename(Subcategories=subcategories,Emissions=emissions)
    })


    output$HousingTotal <- renderText({
      total_estimates %>%
        select(total_type,contains(period)) %>%
        rename(emissions=2) %>%
        filter(total_type=="Housing") %>%
        transmute(emissions=round(emissions,2)) %>%
        paste0(.,ifelse(period=="year"," /yr",
                        ifelse(period=="month"," /mo"," /wk")))
    })

    output$HousingSubTotals <- renderTable({
      household_estimates %>%
        select(categories,subcategories,contains(period)) %>%
        rename(emissions=3) %>%
        filter(categories=="Housing") %>%
        arrange(subcategories) %>%
        group_by(subcategories) %>%
        summarize(emissions=sum(round(emissions,2))) %>%
        rename(Subcategories=subcategories,Emissions=emissions)
    })

    outputOptions(output, "HousingSubTotals", suspendWhenHidden = FALSE)

  })
}

ui <- function() {
  semanticPage(
    h2("Our Accordions"),
    div(class="ui stackable grid",
        div(class="three wide column",
            style="min-width: 350px;",
            accordionMasterUI("accordion",period="month")
        ),
        div(class="four wide column",
            h3("Totals by Category"),
            div(class="ui raised segment",
                style="min-width: 550px;",
                tableOutput("TestTable")
            )
        )
    )
  )
}

server <- function(input, output, session) {

  accordionMasterServer("accordion",period="month")

  output$TestTable <- renderTable({
    total_estimates
  })

}

shinyApp(ui = ui(), server = server)
Reducing Code Redundancies
As you may have noticed, our accordionMasterServer module function has redundant and repetitive code. In shorter words, we have the same scripts doing the same things with one minor change, such as the “categories” filter.
This isn’t too big of a deal on its own, but let’s say we intend to re-use our accordion module across multiple apps. It becomes harder to make minor changes while maintaining consistency without updating many lines of code.
We can reduce these redundancies using both functions and modules.
Let’s start with the low hanging fruit, which is our data wrangling scripts.
Building a Function for Our Total and Subtotals
Right now, we calculate the total emissions for the travel and housing categories separately, as well as a small table presenting emissions by subcategories.
We have five categories overall, which means we would have ten scripts that perform the same steps, unless we turn them into a function.
Down below is the script to calculate total estimates:
total_estimates %>%
  select(total_type,contains(period)) %>%
  rename(emissions=2) %>%
  filter(total_type=="Travel") %>%
  transmute(emissions=round(emissions,2)) %>%
  paste0(.,ifelse(period=="year"," /yr",
                  ifelse(period=="month"," /mo"," /wk")))
Let’s put this in a function called “Totals.” This function will only need the category and time period passed through as arguments, since those are the only variations in the way we use this script currently.
Totals <- function(category,period) {

  total_estimates %>%
    select(total_type,contains(period)) %>%
    rename(emissions=2) %>%
    filter(total_type==category) %>%
    transmute(emissions=round(emissions,2)) %>%
    paste0(.,ifelse(period=="year"," /yr",
                    ifelse(period=="month"," /mo"," /wk")))

}
We can do the same thing for the subtotals. Down below is what it looked like for the travel category and its replacement in functional form.
household_estimates %>%
  select(categories,subcategories,contains(period)) %>%
  rename(emissions=3) %>%
  filter(categories=="Travel") %>%
  arrange(subcategories) %>%
  group_by(subcategories) %>%
  summarize(emissions=sum(round(emissions,2))) %>%
  rename(Subcategories=subcategories,Emissions=emissions)

SubTotals <- function(category,period) {

  household_estimates %>%
    select(categories,subcategories,contains(period)) %>%
    rename(emissions=3) %>%
    filter(categories==category) %>%
    arrange(subcategories) %>%
    group_by(subcategories) %>%
    summarize(emissions=sum(round(emissions,2))) %>%
    rename(Subcategories=subcategories,Emissions=emissions)

}
Now when we want to run this script, all we have to do is enter the function name and the category.
Totals("Travel","year")
SubTotals("Travel","year")
Add both the Totals and SubTotals functions to the top of your app script. You can then call those functions within the accordionMasterServer function, like so:
accordionMasterServer <- function(id,period) {
  moduleServer(id,function(input,output,session) {

    output$GrandTotal <- renderText({
      total_estimates %>%
        select(total_type,contains(period)) %>%
        rename(emissions=2) %>%
        filter(total_type=="Grand") %>%
        transmute(grandtotal=round(emissions,2)) %>%
        paste0(.)
    })

    output$TravelTotal <- renderText({
      Totals("Travel",period)
    })

    output$TravelSubTotals <- renderTable({
      SubTotals("Travel",period)
    })

    output$HousingTotal <- renderText({
      Totals("Housing",period)
    })

    output$HousingSubTotals <- renderTable({
      SubTotals("Housing",period)
    })

    outputOptions(output, "HousingSubTotals", suspendWhenHidden = FALSE)

  })
}
Our script already looks shorter, doesn’t it?
We can take it even further though.
As you may have noticed, output$TravelTotal is nearly identical to output$HousingTotal. Same with output$TravelSubTotals and output$HousingSubTotals. The only difference is the category.
However, since these outputs are paired with functions within accordionMasterUI, we’ll need to create additional modules to reduce these redundancies further.
Building Modules for Titles and Contents
In our accordion, we have a pair of div functions: one with a class of “title” and the other “content”.
The outputs within these div functions have to be matched on the server side. It’s not a burden to maintain these right now, but as we add more categories, it’ll be harder to tinker and improve the aesthetics with such a long script.
We can modularlize the div function pairs on the ui-side and the outputs on the server-side to make life easier for us.
Let’s start with the ui module.
Down below is the current script we use for each accordion section, with the exception of the namespace ID, which is the only thing that changes.
### Title
div(class ="title active",
    h4(class="ui dividing header",textOutput(NS(id,"TravelTotal")))
),
### Content
div(class ="content active",
    tableOutput(NS(id,"TravelSubTotals"))
)
We can wrap this script in a tagList() and place it inside our new accordionTitleContentUI module function. We simply need to remove the word “Travel” from the namespaces.
accordionTitleContentUI <- function (id) {
  tagList(
    div(class = "title active",
        h4(class="ui dividing header",
           textOutput(NS(id,"Total")))
    ),
    div(class = "content active",
        tableOutput(NS(id,"SubTotal"))
    )
  )
}
Now, there is an issue with the module above that you may have noticed. It would set all sections in the accordion to “active,” which means each section would be expanded when you open the application.
We can add an indicator argument to tell the module to make the class “active” only when we want.
In the script below, I update the module function with this argument and an ifelse.
accordionTitleContentUI <- function (id,active_ind=FALSE) {
  tagList(
    div(class = ifelse(active_ind==TRUE,"title active","title"),
        h4(class="ui dividing header",textOutput(NS(id,"Total")))
    ),
    div(class = ifelse(active_ind==TRUE,"content active","content"),
        tableOutput(NS(id,"SubTotal"))
    )
  )
}
This module won’t display data on its own. We need to pair it with a server module function.
Down below, I take what used to be individual outputs in accordionMasterServer and place them in the new module function.
accordionTitleContentServer <- function(id,category,period) {
  moduleServer(id, function(input,output,session) {

    output$Total <- renderText({
      paste0("Total ",category,": ",Totals(category=category,period))
    })

    output$SubTotal <- renderTable({
      SubTotals(category,period)
    })

    outputOptions(output, "SubTotal", suspendWhenHidden = FALSE)
  })
}
As you may have noticed, I replaced the hard coded filters of “Travel” or “Housing” with the argument category. I also added a dynamic label to output$Total that pastes the category argument with the metric reported.
Add these two module functions after your Totals and SubTotals function, but before your accordionMasterUI function, in your app script.
Afterwards, you can replace the redundant code accordionMasterUI and accordionMasterServer with these new modules, like so:
accordionMasterUI <- function(id,period) {
  tagList(
    shiny::tags$script(accordion_js),
    div(class = "ui segment",
        h3(paste(ifelse(period=="year","Yearly",
                        ifelse(period=="month","Monthly","Weekly")),
                 "Carbon Estimates")),
        h3(class="ui grey sub header","Total CO2 Emissions"),
        div(class="ui grid",
            div(class="four column row",
                div(class="column",
                    h2(class="ui dividing header",textOutput(NS(id,"GrandTotal")))),
                div(class="column",
                    strong(
                      ifelse(period=="year"," /year",
                             ifelse(period=="month"," /month"," /week"))
                    )
                )
            )),
        br(),
        div(class="ui accordion",
            accordionTitleContentUI(NS(id,"Travel"),active_ind=TRUE),
            accordionTitleContentUI(NS(id,"Housing"),active_ind=FALSE)
        )
    )
  )
}

accordionMasterServer <- function(id,period) {
  moduleServer(id,function(input,output,session) {

    output$GrandTotal <- renderText({
      total_estimates %>%
        select(total_type,contains(period)) %>%
        rename(emissions=2) %>%
        filter(total_type=="Grand") %>%
        transmute(grandtotal=round(emissions,2)) %>%
        paste0(.)
    })

    accordionTitleContentServer("Travel",category="Travel",period)
    accordionTitleContentServer("Housing",category="Housing",period)

  })
}
If you run the app now, it won’t look much different than before (with the exception of the category labels). We still have some aesthetic improvement to do.
However, these modules will make it a lot easier to make the tweaks in the next few sections. Rather than go through several lines of redundant code, we only have to make the change once before testing it.
Checkpoint
Down below is the code we’ve written so far. If anything does not look right, try comparing your code to mine and see where the mistake might be:
library(shiny)
library(shiny.semantic)
library(tidyverse)
library(readr)

household_estimates <- read_csv("https://raw.githubusercontent.com/taylorrodgers/public_datasets/main/household_carbon_estimates.csv")
total_estimates <- read_csv("https://raw.githubusercontent.com/taylorrodgers/public_datasets/main/total_household_estimates.csv")

# Javascript for Accordion
accordion_js <- "
$(document).ready(function() {
  $('.ui.accordion').accordion();
})"

Totals <- function(category,period) {

  total_estimates %>%
    select(total_type,contains(period)) %>%
    rename(emissions=2) %>%
    filter(total_type==category) %>%
    transmute(emissions=round(emissions,2)) %>%
    paste0(.,ifelse(period=="year"," /yr",
                    ifelse(period=="month"," /mo"," /wk")))

}

SubTotals <- function(category,period) {

  household_estimates %>%
    select(categories,subcategories,contains(period)) %>%
    rename(emissions=3) %>%
    filter(categories==category) %>%
    arrange(subcategories) %>%
    group_by(subcategories) %>%
    summarize(emissions=sum(round(emissions,2))) %>%
    rename(Subcategories=subcategories,Emissions=emissions)

}

accordionTitleContentUI <- function (id,active_ind=FALSE) {
  tagList(
    div(class = ifelse(active_ind==TRUE,"title active","title"),
        h4(class="ui dividing header",textOutput(NS(id,"Total")))
    ),
    div(class = ifelse(active_ind==TRUE,"content active","content"),
        tableOutput(NS(id,"SubTotal"))
    )
  )
}

accordionTitleContentServer <- function(id,category,period) {
  moduleServer(id, function(input,output,session) {

    output$Total <- renderText({
      paste0("Total ",category,": ",Totals(category=category,period=period))
    })

    output$SubTotal <- renderTable({
      SubTotals(category=category,period=period)
    })

    outputOptions(output, "SubTotal", suspendWhenHidden = FALSE)
  })
}

accordionMasterUI <- function(id,period) {
  tagList(
    shiny::tags$script(accordion_js),
    div(class = "ui segment",
        h3(paste(ifelse(period=="year","Yearly",
                        ifelse(period=="month","Monthly","Weekly")),
                 "Carbon Estimates")),
        h3(class="ui grey sub header","Total CO2 Emissions"),
        div(class="ui grid",
            div(class="four column row",
                div(class="column",
                    h2(class="ui dividing header",textOutput(NS(id,"GrandTotal")))),
                div(class="column",
                    strong(
                      ifelse(period=="year"," /year",
                             ifelse(period=="month"," /month"," /week"))
                    )
                )
            )),
        br(),
        div(class="ui accordion",
            accordionTitleContentUI(NS(id,"Travel"),active_ind=TRUE),
            accordionTitleContentUI(NS(id,"Housing"),active_ind=FALSE)
        )
    )
  )
}

accordionMasterServer <- function(id,period) {
  moduleServer(id,function(input,output,session) {

    output$GrandTotal <- renderText({
      total_estimates %>%
        select(total_type,contains(period)) %>%
        rename(emissions=2) %>%
        filter(total_type=="Grand") %>%
        transmute(grandtotal=round(emissions,2)) %>%
        paste0(.)
    })

    accordionTitleContentServer("Travel",category="Travel",period)
    accordionTitleContentServer("Housing",category="Housing",period)

  })
}

ui <- function() {
  semanticPage(
    h2("Our Accordions"),
    div(class="ui stackable grid",
        div(class="three wide column",
            style="min-width: 350px;",
            accordionMasterUI("accordion",period="month")
        ),
        div(class="four wide column",
            h3("Totals by Category"),
            div(class="ui raised segment",
                style="min-width: 550px;",
                tableOutput("TestTable")
            )
        )
    )
  )
}

server <- function(input, output, session) {

  accordionMasterServer("accordion",period="month")

  output$TestTable <- renderTable({
    total_estimates
  })

}

shinyApp(ui = ui(), server = server)
Adding Additional Categories
Now that we have our modules for the title and content written, let’s add the additional categories to our accordion. The three we need to add include food, goods, and services.
Down below, I simply call our accordionTitleContentUI and accordionMasterServer module functions with the new categories.
accordionMasterUI <- function(id,period) {
  tagList(
    shiny::tags$script(accordion_js),
    div(class = "ui segment",
        h3(paste(ifelse(period=="year","Yearly",
                        ifelse(period=="month","Monthly","Weekly")),
                 "Carbon Estimates")),
        h3(class="ui grey sub header","Total CO2 Emissions"),
        div(class="ui grid",
            div(class="four column row",
                div(class="column",
                    h2(class="ui dividing header",textOutput(NS(id,"GrandTotal")))),
                div(class="column",
                    strong(
                      ifelse(period=="year"," /year",
                             ifelse(period=="month"," /month"," /week"))
                    )
                )
            )),
        br(),
        div(class="ui accordion",
            accordionTitleContentUI(NS(id,"Travel"),active_ind=TRUE),
            accordionTitleContentUI(NS(id,"Housing"),active_ind=FALSE),
            accordionTitleContentUI(NS(id,"Food"),active_ind=FALSE),
            accordionTitleContentUI(NS(id,"Goods"),active_ind=FALSE),
            accordionTitleContentUI(NS(id,"Services"),active_ind=FALSE)
        )
    )
  )
}

accordionMasterServer <- function(id,period) {
  moduleServer(id,function(input,output,session) {

    output$GrandTotal <- renderText({
      total_estimates %>%
        select(total_type,contains(period)) %>%
        rename(emissions=2) %>%
        filter(total_type=="Grand") %>%
        transmute(grandtotal=round(emissions,2)) %>%
        paste0(.)
    })

    accordionTitleContentServer("Travel",category="Travel",period)
    accordionTitleContentServer("Housing",category="Housing",period)
    accordionTitleContentServer("Food",category="Food",period)
    accordionTitleContentServer("Goods",category="Goods",period)
    accordionTitleContentServer("Services",category="Services",period)

  })
}
Now when you run the application, you will see all categories included in the accordion now.
Improving the Titles for Each Accordion Section
Earlier, I added a temporary solution to our section headers. However, I don’t like how the category label and the metric bunch up together. We have a lot of unused white space to the right of it. I think we could do better.
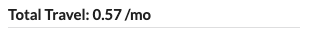
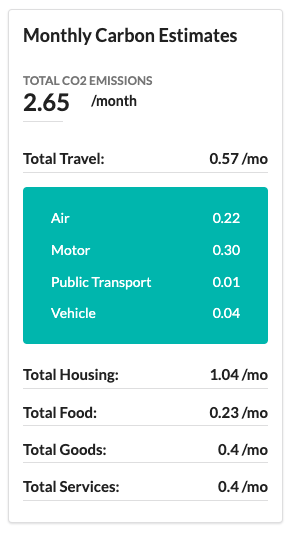
Let’s change this so that the actual metric (“0.57 / mo”) floats to the right, while the label (“Total Travel:”) remains on the left side.
We’ll need to update the accordionTitleContentUI and accordionTitleContentServer modules to space this text apart.
In the accordionTitleContentUI function, we can add a few div functions to specify the grid and column setups we want. We’ll also create additional textOutput functions for the “TitleHeader”.
accordionTitleContentUI <- function (id,active_ind) {
  tagList(
    div(class = ifelse(active_ind==TRUE,"title active","title"),
        h4(class="ui dividing header",
           div(class="ui grid",
               div(class="two column row",
                 div(class="left floated column",
                     textOutput(NS(id,"TitleHeader"),inline=TRUE)),
                 div(class="right floated column",
                     style="text-align: right",
                     textOutput(NS(id,"Total")),inline=TRUE))
           )
        )
    ),
    div(class = ifelse(active_ind==TRUE,"content active","content"),
        tableOutput(NS(id,"SubTotal"))
    )
  )
}
In the accordionTitleContentServer function, we’ll need to break apart the text into separate renderText functions:
accordionTitleContentServer <- function(id,category,period) {
moduleServer(id, function(input,output,session) {
output$TitleHeader <- renderText({
paste0("Total ",category,": ")
})
output$Total <- renderText({
Totals(category=category,period=period)
})
output$SubTotal <- renderTable({
SubTotals(category,period=period)
})
outputOptions(output, "SubTotal", suspendWhenHidden = FALSE)
})
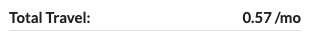
}Now when we run it, we see that one floats to the left and the other floats to the right.
Adding Background Color to the Content Section
Right now, our content section (which has the data table for the subcategories) looks flat. I think we could make it pop out with a background color.
To make this update, we simply update the accordionTitleContentUI module with div(class="ui teal inverted segment",…) .
accordionTitleContentUI <- function (id,active_ind) {
  tagList(
    div(class = ifelse(active_ind==TRUE,"title active","title"),
        h4(class="ui dividing header",textOutput(NS(id,"Total")))
    ),
    div(class = ifelse(active_ind==TRUE,"content active","content"),
        div(class="ui teal inverted segment",
          tableOutput(NS(id,"SubTotal"))
        )
    )
  )
}
Now our content sections standout from the title section above.
If you’re not a fan of the teal, try playing around with the segment settings. You can read about segments here: https://fomantic-ui.com/elements/segment.html
Removing Subcategory Labels and Filling Space
There are a few more tweaks we can make to our subcategory table.
For starters, we don’t really need the labels in the table. It’s already implied by other labels that we’re looking at the emissions of the subcategories of the category above them.
For that reason, we can remove the data set labels.
Second, the data set within the content section doesn’t use the space it’s allocated. It looks a little off center.
We can make both these updates with arguments in the renderTable function.
Down below, we make this change in accordionTitleContentServer, like so:
output$SubTotal <- renderTable(width = "100%",colnames=FALSE,{
  SubTotals(category,period=period)
})
When you compare this to the image in the last section, you can see how this looks differently:
Dictating Min and Max Accordion Widths
It’s a good idea to set a min and max width for the accordion so that it looks relatively consistent from app to app. Otherwise, the accordion may take up the entire screen on big monitors or look rather thin on small screens. You can do this with the style argument for the senior div function in accordionMasterUI.
accordionMasterUI <- function(id,period) {
  tagList(
    shiny::tags$script(accordion_js),
    div(class = "ui segment",
        style="min-width: 250px; max-width: 275px",
      ...
    )
  )
}
Final Step: Showing All Three Accordions
We’re almost done! We built a functional set of accordion modules. We can show all three periods on our application.
Down below, I tweaked our original ui function for the application to call the accordionMasterUI and accordionMasterServer module functions three times for year, month, and week. (Note: I also tweaked the column arrangement so the spacing works)
ui <- function() {
  semanticPage(
    h2("Our Accordions"),
    div(class="ui stackable grid",
        div(class="four wide computer eight wide tablet sixteen wide mobile column",
            accordionMasterUI("year",period="year")
        ),
        div(class="four wide computer eight wide tablet sixteen wide mobile column",
            accordionMasterUI("month",period="month")
        ),
        div(class="four wide computer eight wide tablet sixteen wide mobile column",
            accordionMasterUI("week",period="week")
        ),
        div(class="two column row",
            div(class="four wide column",
                h3("Totals by Category"),
                div(class="ui raised segment",
                    style="min-width: 550px;",
                    tableOutput("TestTable")
                )
            )
        )
    )
  )
}

server <- function(input, output, session) {

  accordionMasterServer("year",period="year")
  accordionMasterServer("month",period="month")
  accordionMasterServer("week",period="week")

  output$TestTable <- renderTable({
    total_estimates
  })

}

shinyApp(ui = ui(), server = server)
Whenever we run this app, we see three accordions.
I hope you enjoyed this tutorial! Thanks for reading and feel free to reach out to Free State Analytics for R Shiny development or any other data science needs.